Melangkaui Batasan: Sepadukan Kepintaran Tanah Dikuasakan AI ke dalam Aliran Kerja Anda
Ubah data satelit global kepada maklumat yang boleh diambil tindakan dengan satu API yang boleh diskala.
Memperkasakan Sistem dengan Kebenaran Bumi (Ground Truth) yang Boleh Disahkan
Tukar isyarat kompleks kepada data yang boleh ditindaklanjuti untuk mengotomatiskan pemantauan tanah dan menghapuskan tekaan.
Skala Global & Tanpa Penderia
Resolusi Ketepatan Tinggi
Kemas Kini Kekerapan Tinggi
14+ Indeks Khusus: Kesihatan Tanaman, Stres Air dan Potensi Tanah
Rujukan & Panduan Pengguna API FarmiSpace
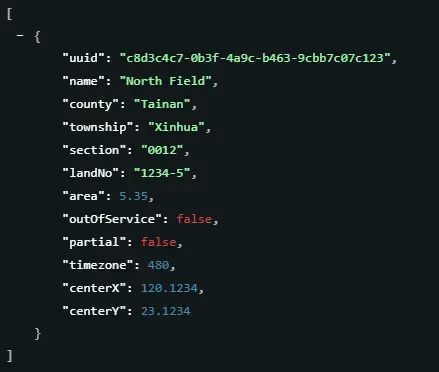
Pengurusan Ladang & Tanah
Asas pendigitalan aset
Tukar sempadan geografi kepada aset data standard, menyokong segalanya daripada import GeoJSON kepada pengurusan kitaran hayat.
Ciri-ciri Utama :
- Akses kepada metadata spatial untuk semua tanah berdaftar.
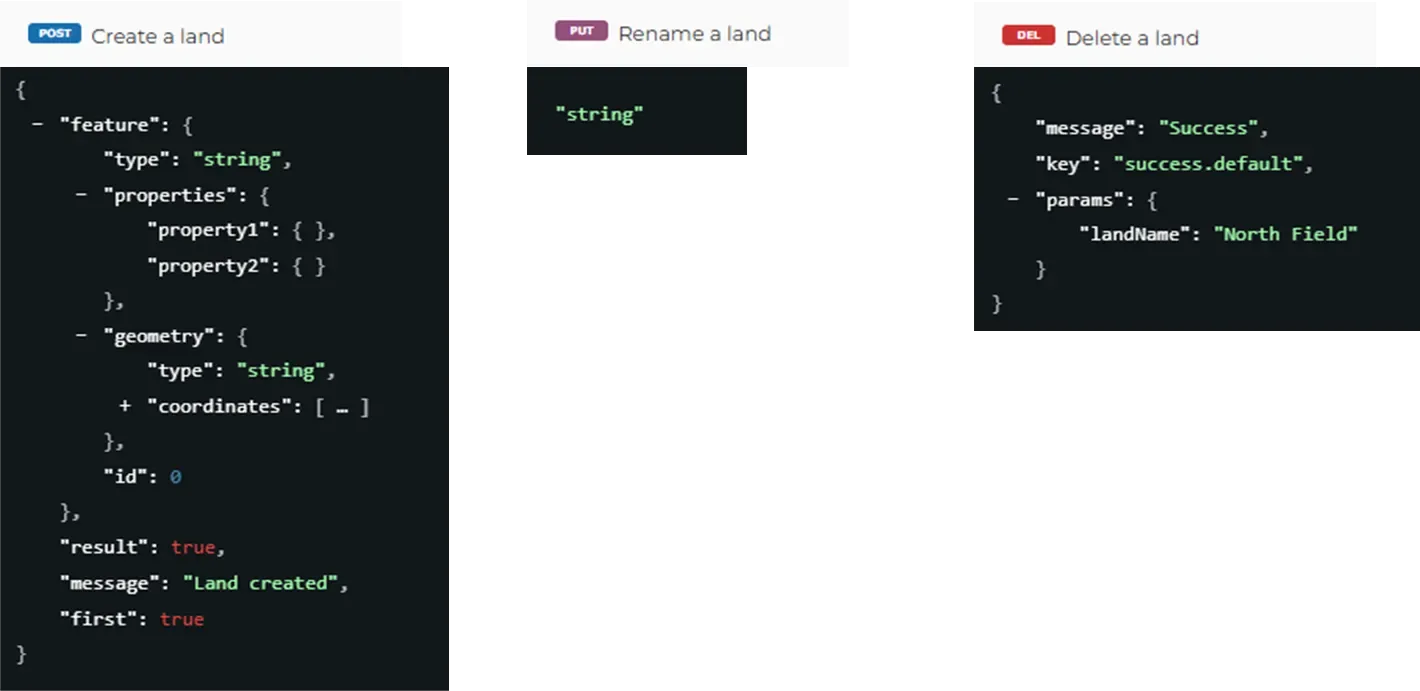
- API standard untuk penciptaan, penamaan semula dan pemadaman tanah.
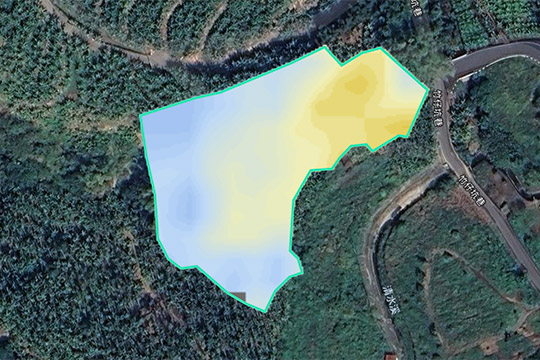
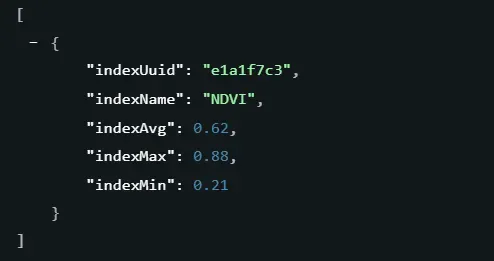
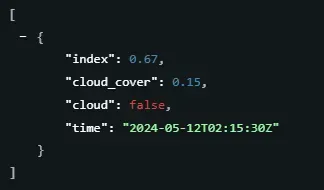
Data Indeks
Asas kuantitatif untuk membuat keputusan
Ubah kekerapan pemerhatian kepada garis masa yang boleh dianalisis dan matriks statistik untuk menyokong penjejakan trend dan pengesanan anomali.
Ciri-ciri Utama :
- Garis Masa Pemerhatian : Tapis tarikh data yang tersedia untuk tanah dan indeks tertentu.
- Matriks Statistik : Dapatkan nilai Min/Maks/Purata untuk mengubah imejan kepada nombor yang boleh diambil tindakan.
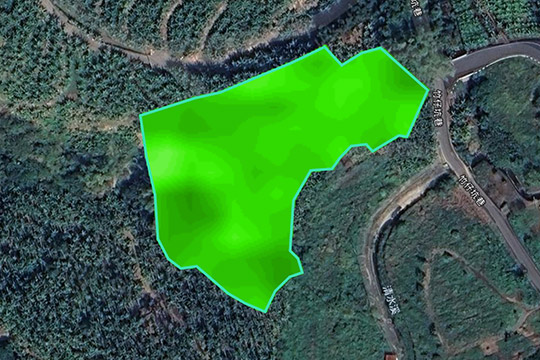
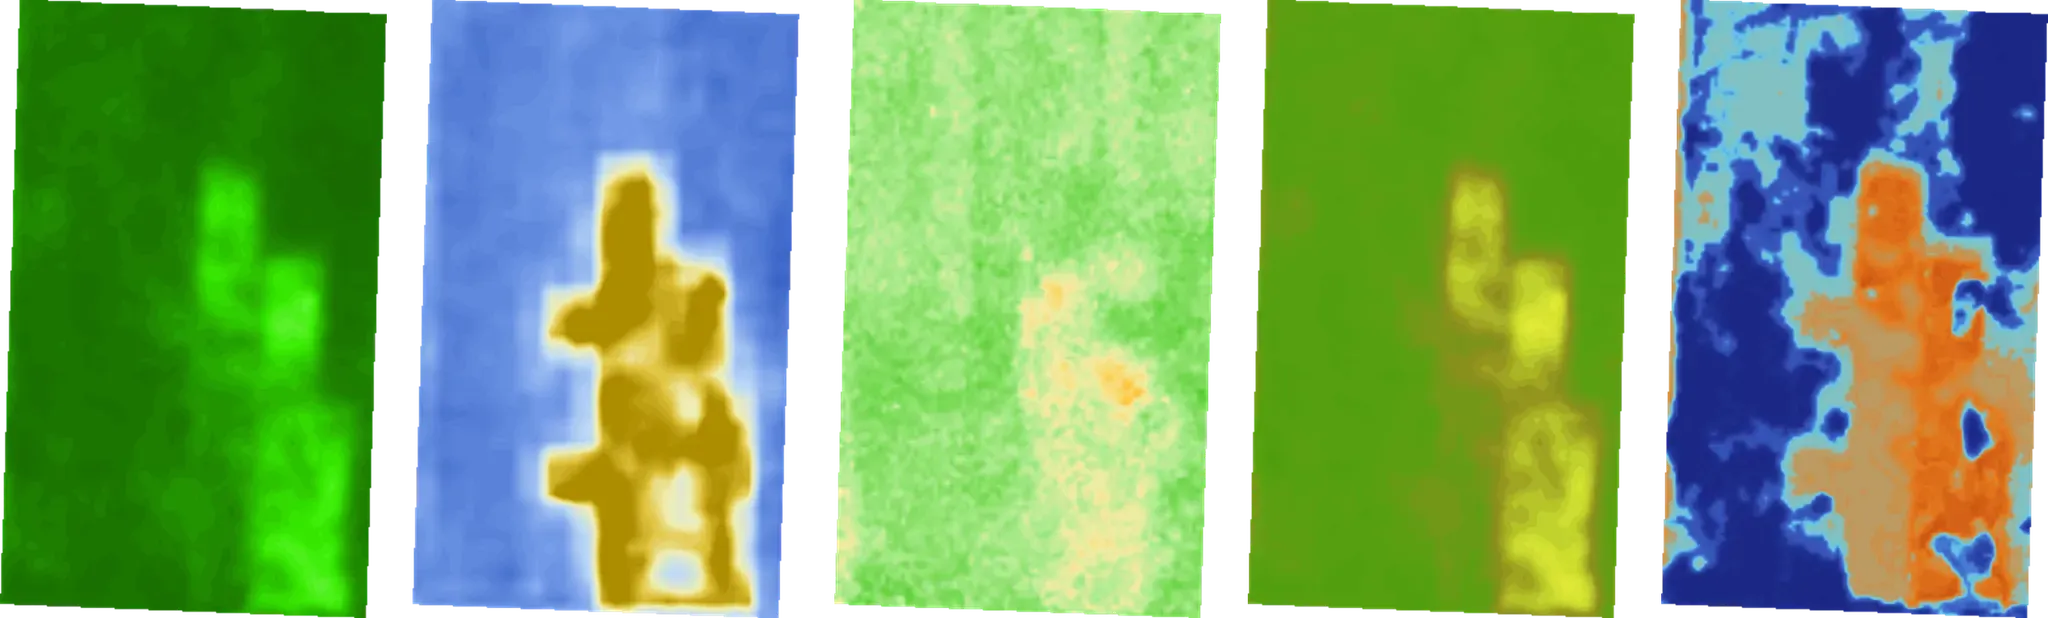
Imejan Indeks
Sinergi data visual dan mentah
Akses peleraian grid 1m x 1m untuk paparan intuitif dan analisis gred profesional.
Ciri-ciri Utama :
- Dapatkan imejan beresolusi tinggi untuk tarikh dan indeks tertentu.
- Menyokong kedua-dua Visual RGB untuk paparan dan Raw GeoTIFF untuk analisis data mentah.
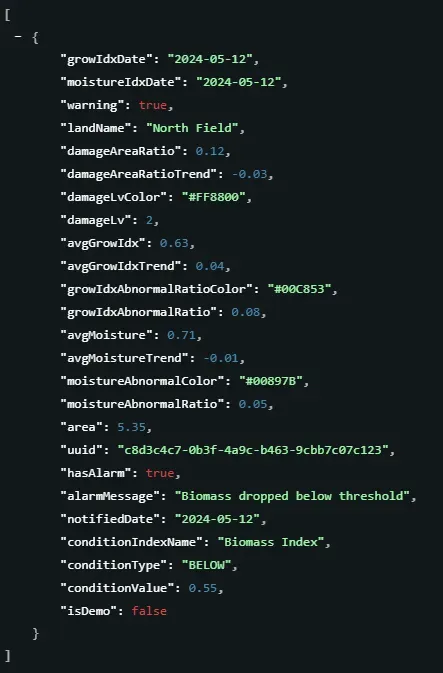
Trend & Amaran
Dari pemantauan ke ramalan
Tapis untuk anomali dan jejaki trend jangka panjang untuk mengubah data besar kepada kepintaran risiko sensitif masa.
Ciri-ciri Utama :
- Amaran Pintar:Kenal pasti medan yang memerlukan perhatian berdasarkan status amaran terkini.
- Jejaki trend indeks sepanjang julat tarikh yang ditetapkan untuk analisis siri masa.
Nota Tinjauan Lapangan
Penyegerakan Kebenaran Lapangan
Semua anotasi FarmiTag untuk tanah yang dimiliki oleh akaun, termasuk butiran nota, foto dan lokasi spatial.
Ciri-ciri Utama :
- Integrasi Maya & Nyata :Segerakkan nota medan (FarmiTags) dan foto terus ke peta digital anda.
- Sesuai GIS :Visualisasikan isu perosak atau peringkat pertumbuhan dengan geolokasi yang tepat.

Ahli & Akaun
Kawalan akses dan pengoptimuman sumber
Pemantauan langganan dan kuota untuk memastikan akses data yang tepat bagi semua ahli organisasi.
Ciri-ciri Utama :
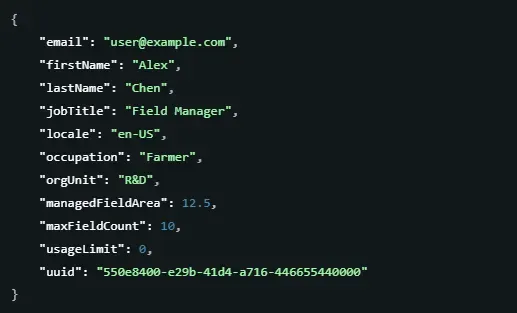
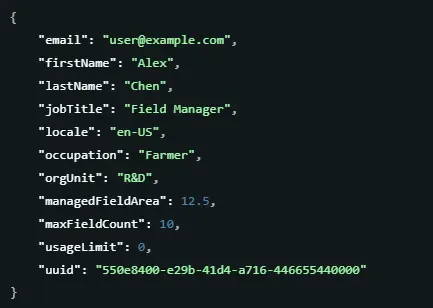
- Pemantauan Kuota : Pantau butiran profil, status langganan dan kuota penggunaan.
- Penyesuaian Profil : Kemas kini metadata ahli, termasuk jawatan, jabatan dan tetapan bahasa.
Maklumat Perkhidmatan
Asas persekitaran pembangunan yang stabil
Segerakkan dengan parameter standard untuk persekitaran berskala yang stabil.
Ciri-ciri Utama :
- Versi perkhidmatan API semasa untuk mengesahkan status persekitaran.
- Senarai semua indeks yang tersedia bersama dengan penerangan dan statusnya.
- Senarai penuh varieti tanaman yang disokong oleh platform pada masa ini.
Bermula
Daftar & Dapatkan Kunci API Anda
Untuk memastikan penyepaduan yang selamat dan lancar, kunci API diperlukan untuk semua permintaan. Hubungi pasukan kami untuk meminta kunci percubaan dan mula mengubah pengalaman pengurusan tanah anda hari ini.